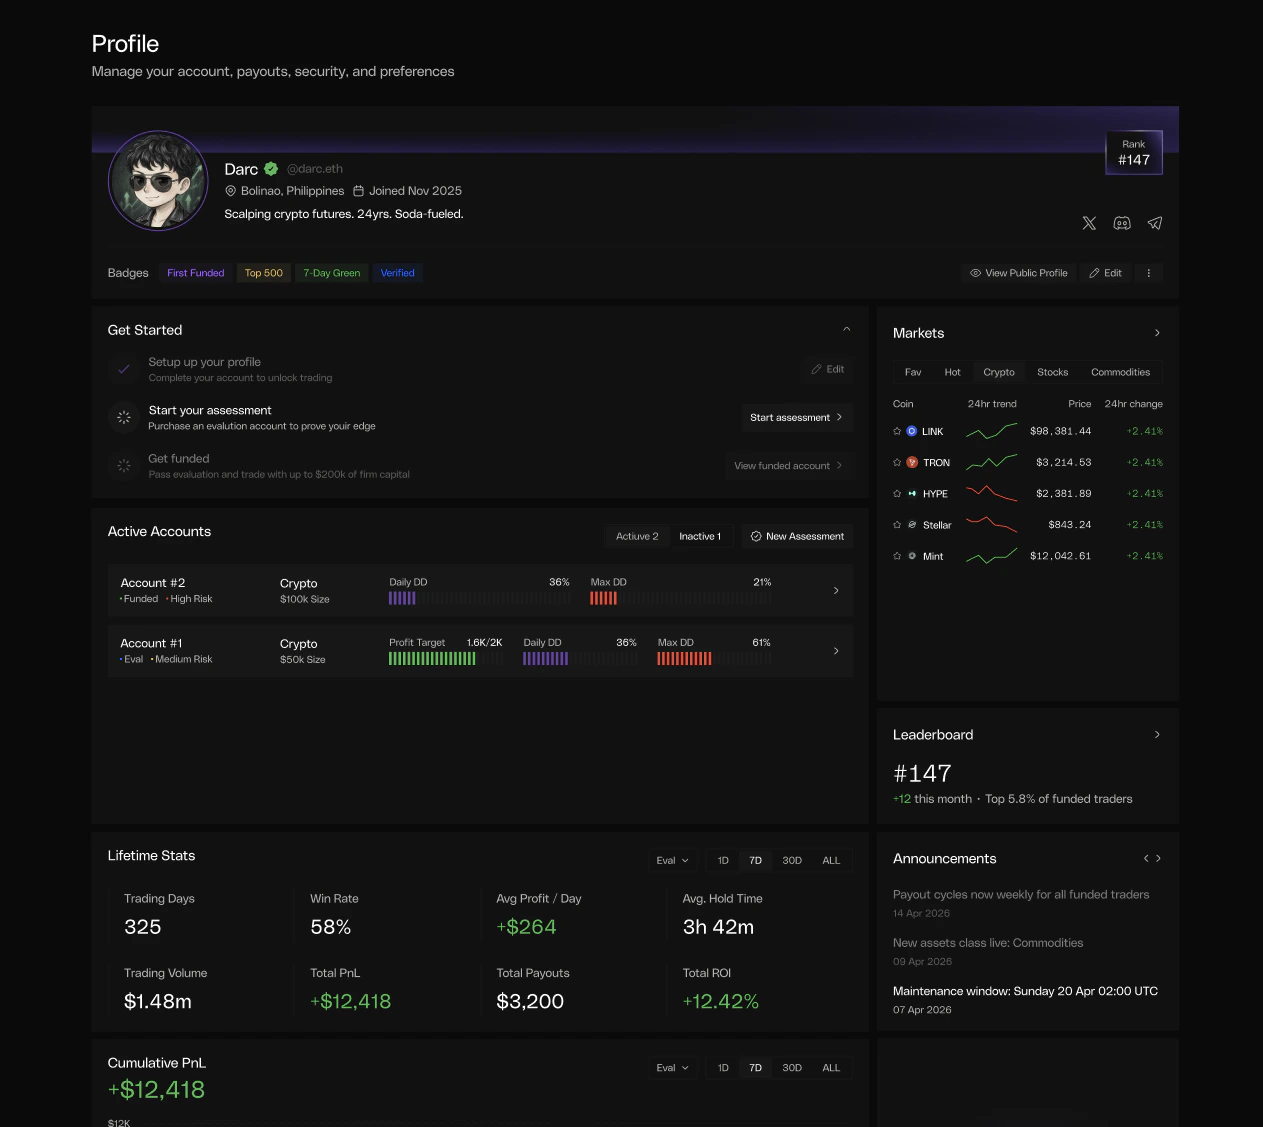
Get Started
A checklist near the top of the page surfaces the next action for new users - setting up your profile, purchasing an evaluation, and passing into a funded account. Completed steps collapse out of the way once you’ve finished them.Active Accounts
Every account you own appears as a card with live progress bars for Daily DD and Max DD, plus profit-target progress for active assessments. Toggle between Active and Inactive to see breached, expired, or passed accounts. Click any card to jump straight to its Dashboard view.Lifetime Stats
Filter by account type (assessments only, funded only, or all) and time window (7D · 30D · ALL). All metrics are computed from closed positions and respect the filters you select.Fees and funding are baked into every PnL number here. Net Realized PnL
subtracts trading fees and includes funding (positive or negative). Win Rate
is based on per-position realized PnL - the result of the trade itself.
Cumulative PnL - All Accounts
A single chart plots combined performance across every matched account. Pause an account and its contribution flatlines; resume trading and the line picks back up. Time-window controls (1D · 7D · 30D · ALL) match the stats panel above.Side Widgets
Three lightweight widgets sit alongside the main view:Markets
Live ticker for top movers across Crypto, Stocks, Commodities and other
asset classes.
Leaderboard
Your current global rank and percentile band, with a deep link to the full
Leaderboard.
Announcements
Platform updates - new asset classes, maintenance windows, payout cycle
notices.
Live values stream in real time. Equity, daily drawdown, max-drawdown
distance and profit-target progress update at the speed of the market.
Historical charts use the 15-minute snapshot history.