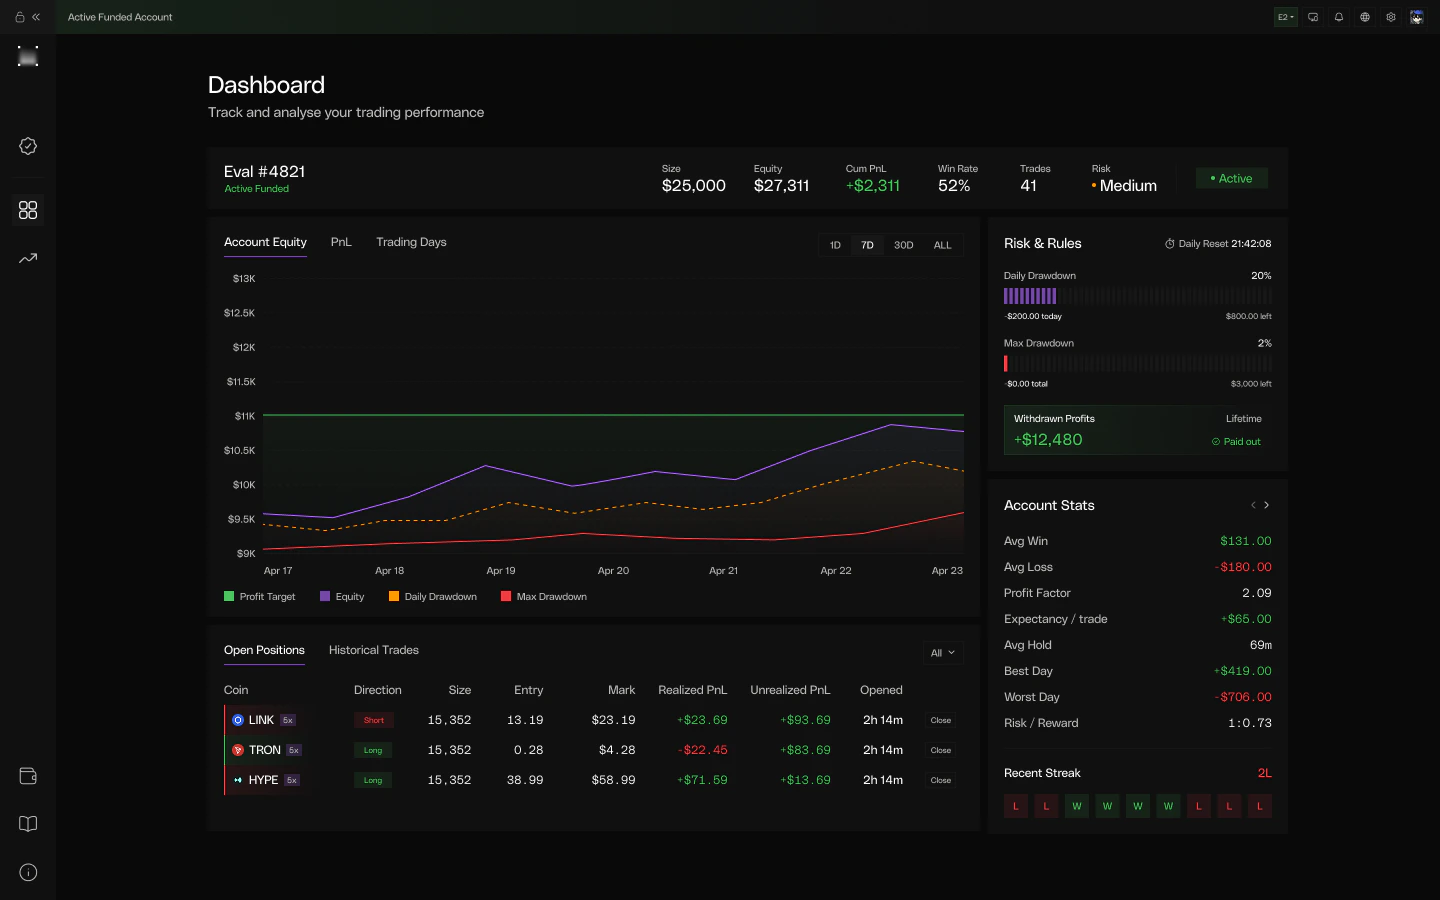
Performance Charts
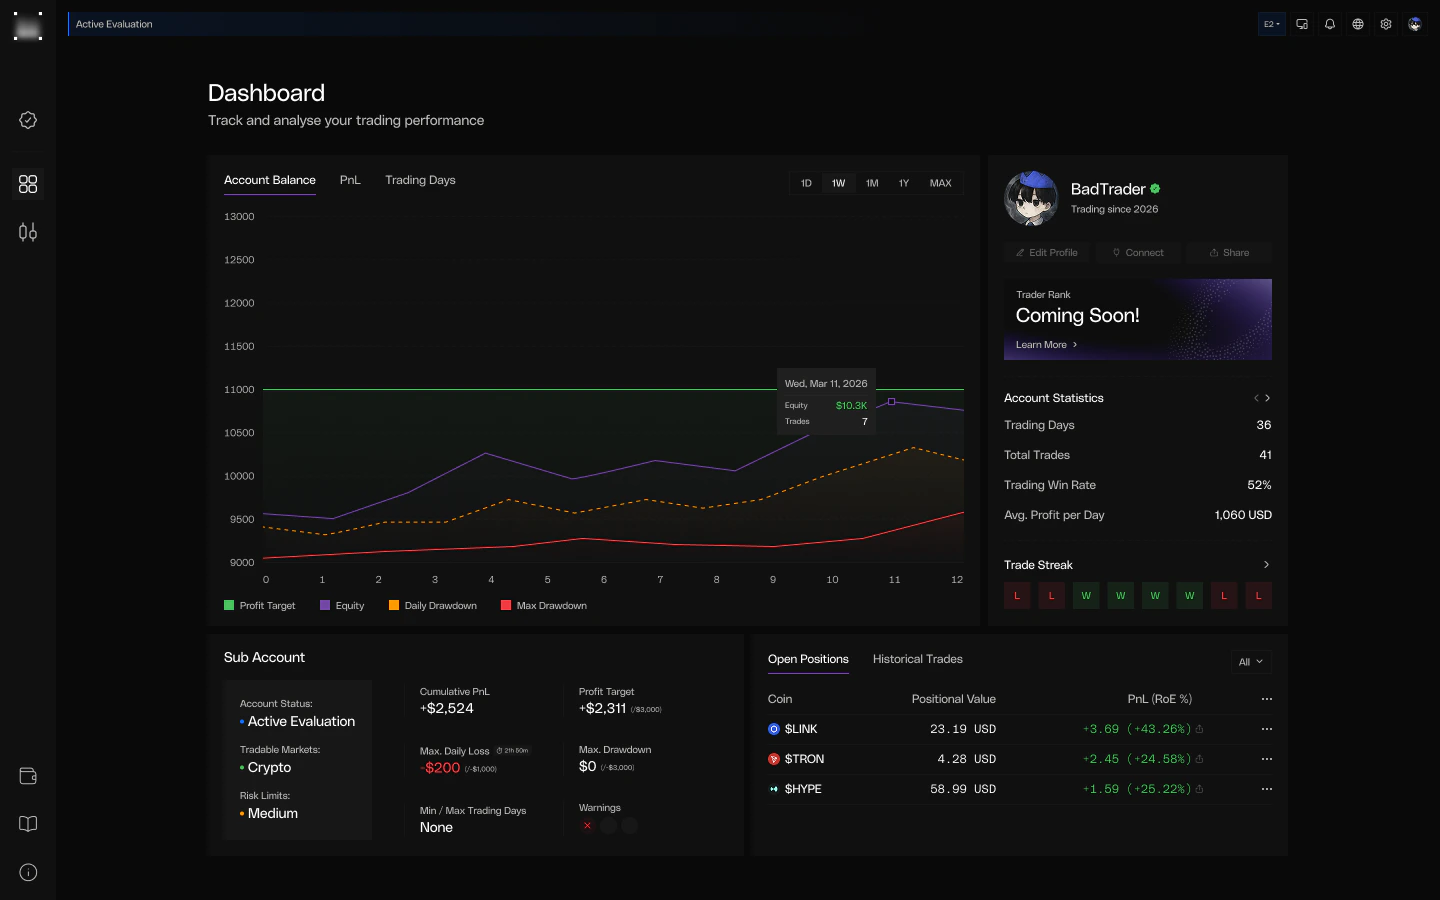
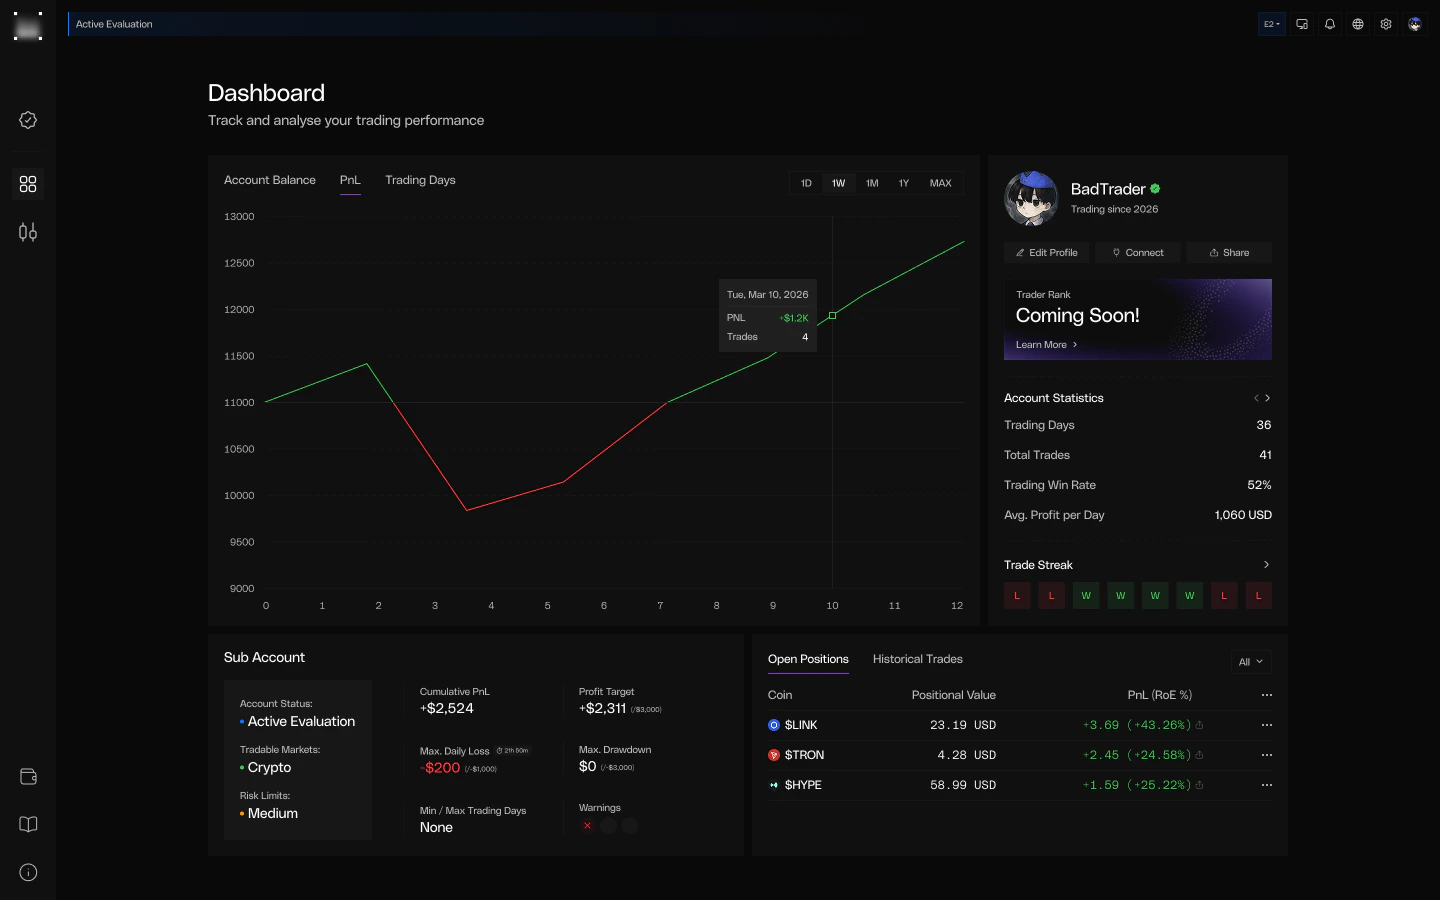
Historical performance data with selectable time ranges (1D, 1W, 1M, 1Y, MAX). The server auto-selects resolution based on the time span — hourly points for intraday, daily points for longer ranges.- Trading Days
- Account Balance
- PnL
Monthly calendar grid showing daily net PnL, trade count, and end-of-day balance. Click any day to open a detail drawer with an intraday equity chart and full trade list. Days with no trading activity are left blank.
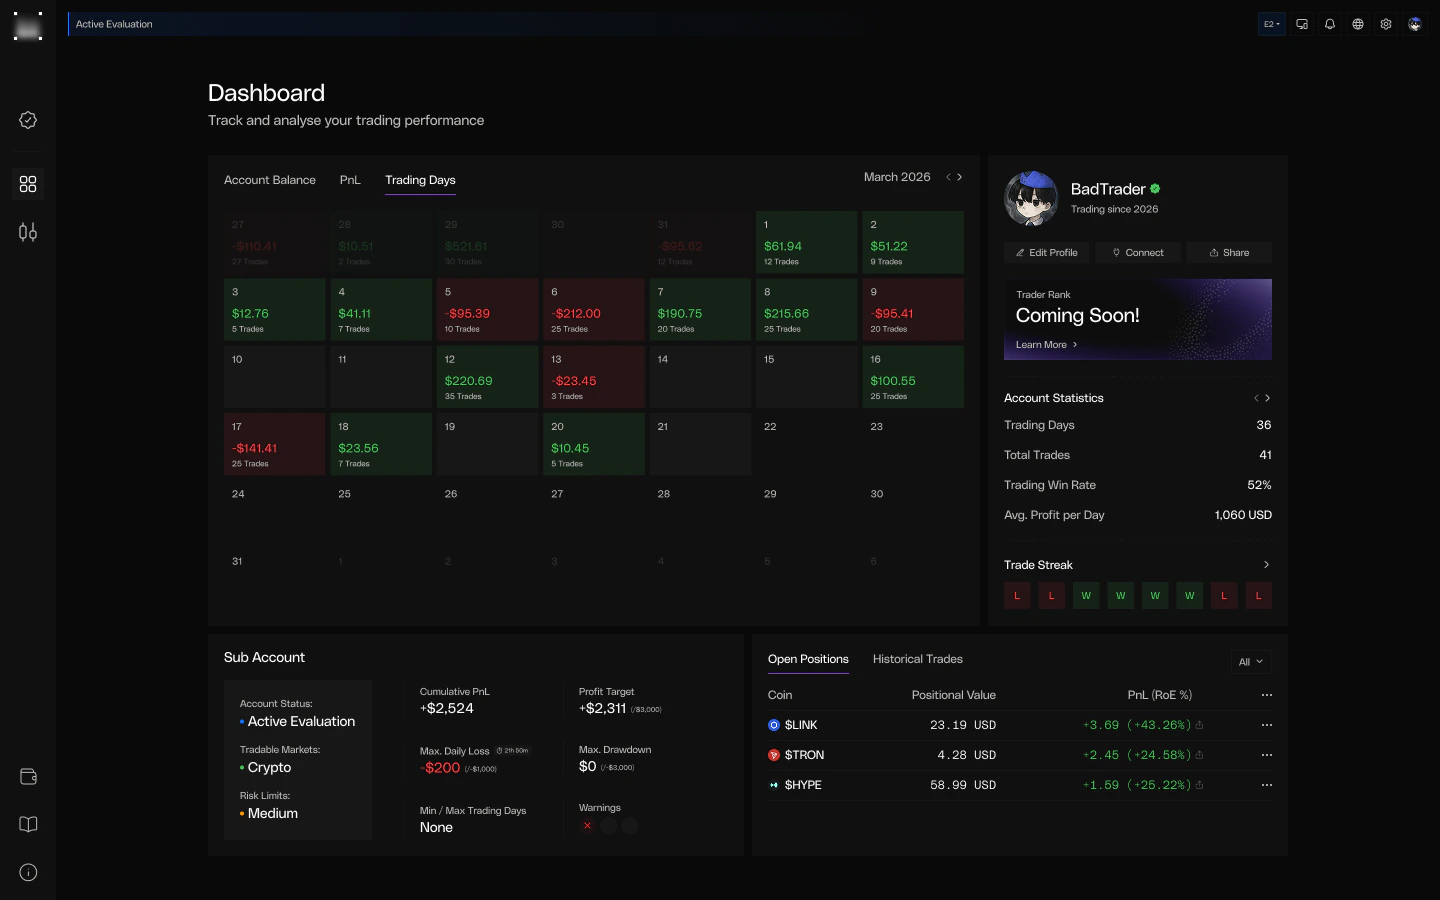
Account Statistics
Lifetime aggregates for the selected sub-account. Metrics are computed from closed positions only — open positions are excluded until they close.| Metric | Description |
|---|---|
| Trading Days | Days with at least one position opened or closed (UTC boundaries) |
| Total Trades | Total closed positions across the account lifetime |
| Win Rate | Winning trades / total closed trades. Break-even trades (PnL = 0) count toward total but not as wins or losses |
| Avg. Profit per Day | Net PnL (after fees and funding) divided by days since account creation |
This is the sub-account view — each assessment and funded account has its own statistics. A master account dashboard aggregating across all sub-accounts is coming soon.
Sub-Account Overview
Each sub-account displays its current status and risk parameters at a glance.| Field | Description |
|---|---|
| Account Status | Active evaluation, passed, or breached |
| Cumulative PnL | Lifetime net PnL (realized PnL - fees + funding) |
| Profit Target | Progress toward the required profit target amount |
| Max Daily Loss | Current daily loss relative to the daily loss limit, with countdown timer |
| Max Drawdown | Current drawdown relative to the max drawdown limit |
| Tradable Markets | Asset classes available for this account (Crypto, TradFi, or All Markets) |
| Risk Limits | Risk level tier assigned to the account |
| Min/Max Trading Days | Trading day requirements for the evaluation |
| Warnings | Warnings for prohibited trading activities. See the Rulebook for details |


