> ## Documentation Index
> Fetch the complete documentation index at: https://hypernova.xyz/docs/llms.txt
> Use this file to discover all available pages before exploring further.
# Home
> A single view across every account you trade
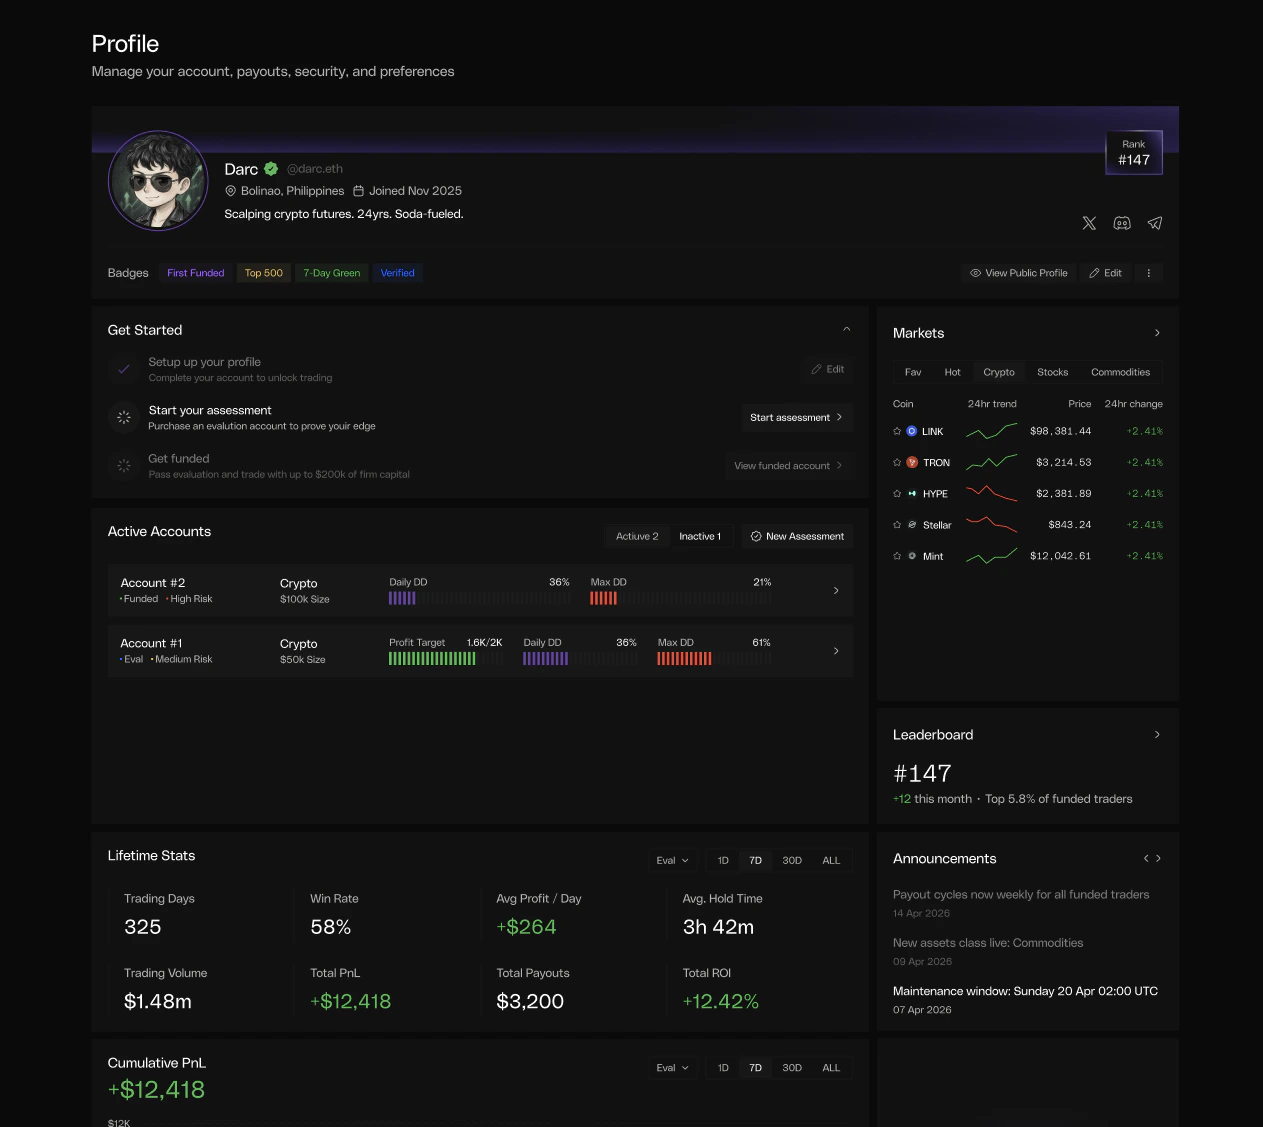
The Home page aggregates performance across **every account you own** - assessments and funded accounts in one place. It's the first thing you see when you log in.
 ## Get Started
A checklist near the top of the page surfaces the next action for new users - setting up your profile, purchasing an evaluation, and passing into a funded account. Completed steps collapse out of the way once you've finished them.
## Active Accounts
Every account you own appears as a card with live progress bars for **Daily DD** and **Max DD**, plus profit-target progress for active assessments. Toggle between **Active** and **Inactive** to see breached, expired, or passed accounts. Click any card to jump straight to its [Dashboard](/dashboard) view.
| State | What it means |
| --------------------- | ---------------------------------------------------------- |
| **Active assessment** | Currently trading toward the profit target |
| **Passed** | Completed assessment, waiting for funded-account signature |
| **Active funded** | Live funded account |
| **Inactive** | Breached, expired, or passed-but-unsigned accounts |
## Lifetime Stats
Filter by account type (assessments only, funded only, or all) and time window (**7D · 30D · ALL**). All metrics are computed from closed positions and respect the filters you select.
| Stat | Definition |
| ------------------------------- | ------------------------------------------------------------------------------------------------------ |
| **Trading Days** | Distinct UTC days with any opening or closing activity in the window |
| **Total Trades** | Closed positions in the window |
| **Win Rate** | Winning trades ÷ closed trades in the window |
| **Avg. Hold Time** | Average position duration in the window |
| **Trading Volume** | Opening notional across all accounts in the window |
| **Net Realized PnL** | `realized PnL − fees + funding` across closed positions in the window - fees subtracted, funding added |
| **Total Payouts** | Sum of payouts taken across funded accounts in the window |
| **ROI** | Net PnL ÷ summed initial balance across all matched accounts × 100 |
| **Avg. Profit per Trading Day** | Net PnL ÷ trading-day count in the window - only days you actually traded |
**Fees and funding are baked into every PnL number here.** Net Realized PnL
subtracts trading fees and includes funding (positive or negative). Win Rate
is based on per-position realized PnL - the result of the trade itself.
## Cumulative PnL - All Accounts
A single chart plots combined performance across every matched account. Pause an account and its contribution flatlines; resume trading and the line picks back up. Time-window controls (**1D · 7D · 30D · ALL**) match the stats panel above.
## Side Widgets
Three lightweight widgets sit alongside the main view:
Live ticker for top movers across Crypto, Stocks, Commodities and other
asset classes.
Your current global rank and percentile band, with a deep link to the full
[Leaderboard](/leaderboard).
Platform updates - new asset classes, maintenance windows, payout cycle
notices.
**Live values stream in real time.** Equity, daily drawdown, max-drawdown
distance and profit-target progress update at the speed of the market.
Historical charts use the 15-minute snapshot history.
## Get Started
A checklist near the top of the page surfaces the next action for new users - setting up your profile, purchasing an evaluation, and passing into a funded account. Completed steps collapse out of the way once you've finished them.
## Active Accounts
Every account you own appears as a card with live progress bars for **Daily DD** and **Max DD**, plus profit-target progress for active assessments. Toggle between **Active** and **Inactive** to see breached, expired, or passed accounts. Click any card to jump straight to its [Dashboard](/dashboard) view.
| State | What it means |
| --------------------- | ---------------------------------------------------------- |
| **Active assessment** | Currently trading toward the profit target |
| **Passed** | Completed assessment, waiting for funded-account signature |
| **Active funded** | Live funded account |
| **Inactive** | Breached, expired, or passed-but-unsigned accounts |
## Lifetime Stats
Filter by account type (assessments only, funded only, or all) and time window (**7D · 30D · ALL**). All metrics are computed from closed positions and respect the filters you select.
| Stat | Definition |
| ------------------------------- | ------------------------------------------------------------------------------------------------------ |
| **Trading Days** | Distinct UTC days with any opening or closing activity in the window |
| **Total Trades** | Closed positions in the window |
| **Win Rate** | Winning trades ÷ closed trades in the window |
| **Avg. Hold Time** | Average position duration in the window |
| **Trading Volume** | Opening notional across all accounts in the window |
| **Net Realized PnL** | `realized PnL − fees + funding` across closed positions in the window - fees subtracted, funding added |
| **Total Payouts** | Sum of payouts taken across funded accounts in the window |
| **ROI** | Net PnL ÷ summed initial balance across all matched accounts × 100 |
| **Avg. Profit per Trading Day** | Net PnL ÷ trading-day count in the window - only days you actually traded |
**Fees and funding are baked into every PnL number here.** Net Realized PnL
subtracts trading fees and includes funding (positive or negative). Win Rate
is based on per-position realized PnL - the result of the trade itself.
## Cumulative PnL - All Accounts
A single chart plots combined performance across every matched account. Pause an account and its contribution flatlines; resume trading and the line picks back up. Time-window controls (**1D · 7D · 30D · ALL**) match the stats panel above.
## Side Widgets
Three lightweight widgets sit alongside the main view:
Live ticker for top movers across Crypto, Stocks, Commodities and other
asset classes.
Your current global rank and percentile band, with a deep link to the full
[Leaderboard](/leaderboard).
Platform updates - new asset classes, maintenance windows, payout cycle
notices.
**Live values stream in real time.** Equity, daily drawdown, max-drawdown
distance and profit-target progress update at the speed of the market.
Historical charts use the 15-minute snapshot history.