> ## Documentation Index
> Fetch the complete documentation index at: https://hypernova.xyz/docs/llms.txt
> Use this file to discover all available pages before exploring further.
# Dashboard
> Track and analyse your trading performance
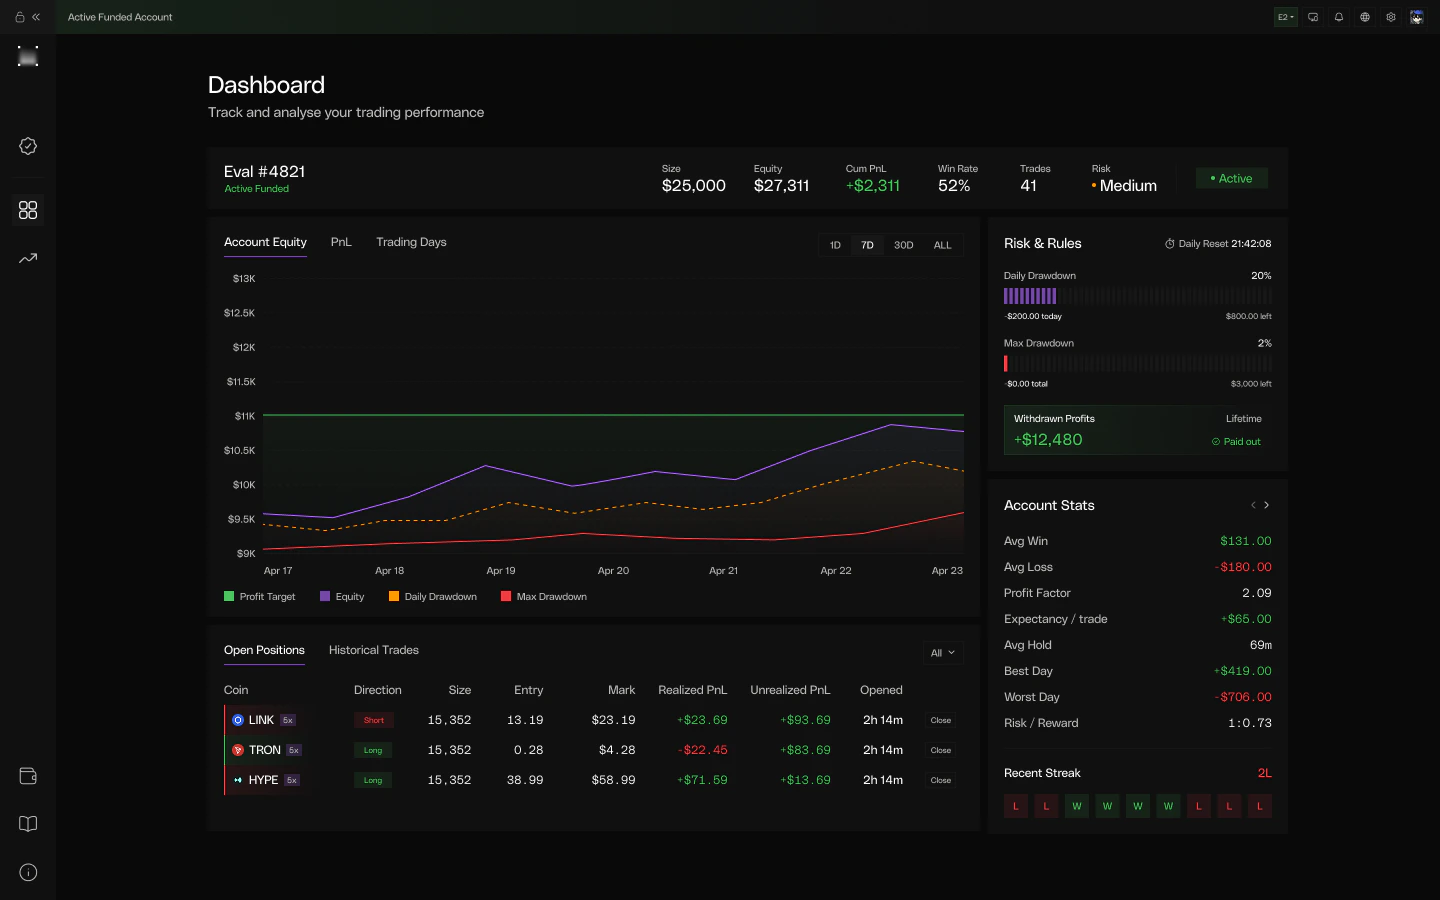
The dashboard is your central hub for monitoring performance across assessments and funded accounts. Equity snapshots are captured every 15 minutes and aggregated into charts, calendars, and lifetime metrics - giving you a clear picture of how you're trading.
 ## Performance Charts
Historical performance data with selectable time ranges (1D, 1W, 1M, 1Y, MAX). The server auto-selects resolution based on the time span - 15-minute points for intraday, daily points for longer ranges.
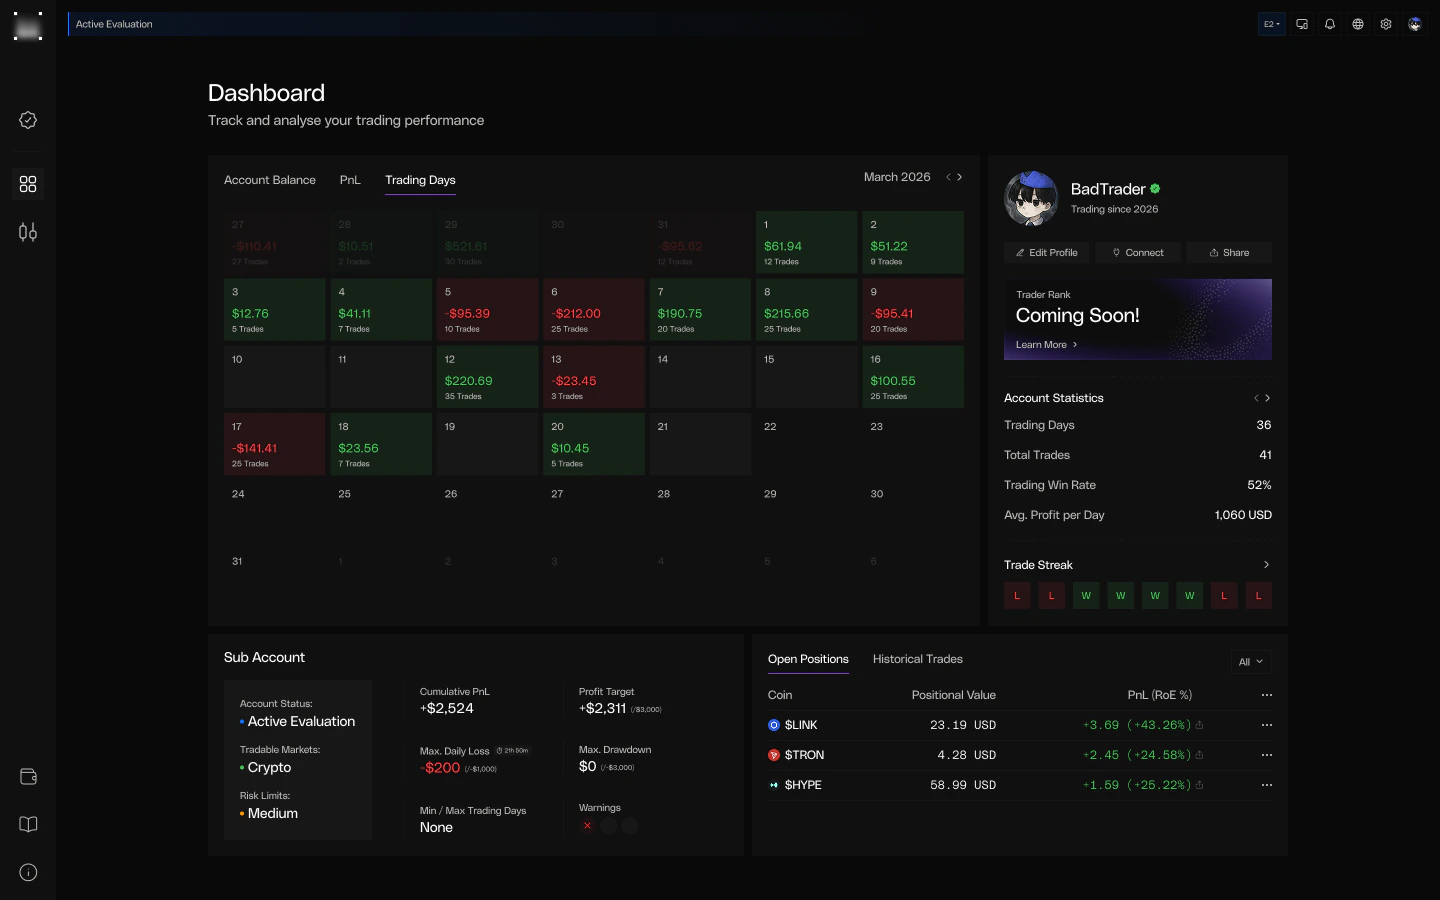
Monthly calendar grid showing daily net PnL, trade count, and end-of-day balance. Click any day to open a detail drawer with an intraday equity chart and full trade list. Days with no trading activity are left blank.
## Performance Charts
Historical performance data with selectable time ranges (1D, 1W, 1M, 1Y, MAX). The server auto-selects resolution based on the time span - 15-minute points for intraday, daily points for longer ranges.
Monthly calendar grid showing daily net PnL, trade count, and end-of-day balance. Click any day to open a detail drawer with an intraday equity chart and full trade list. Days with no trading activity are left blank.
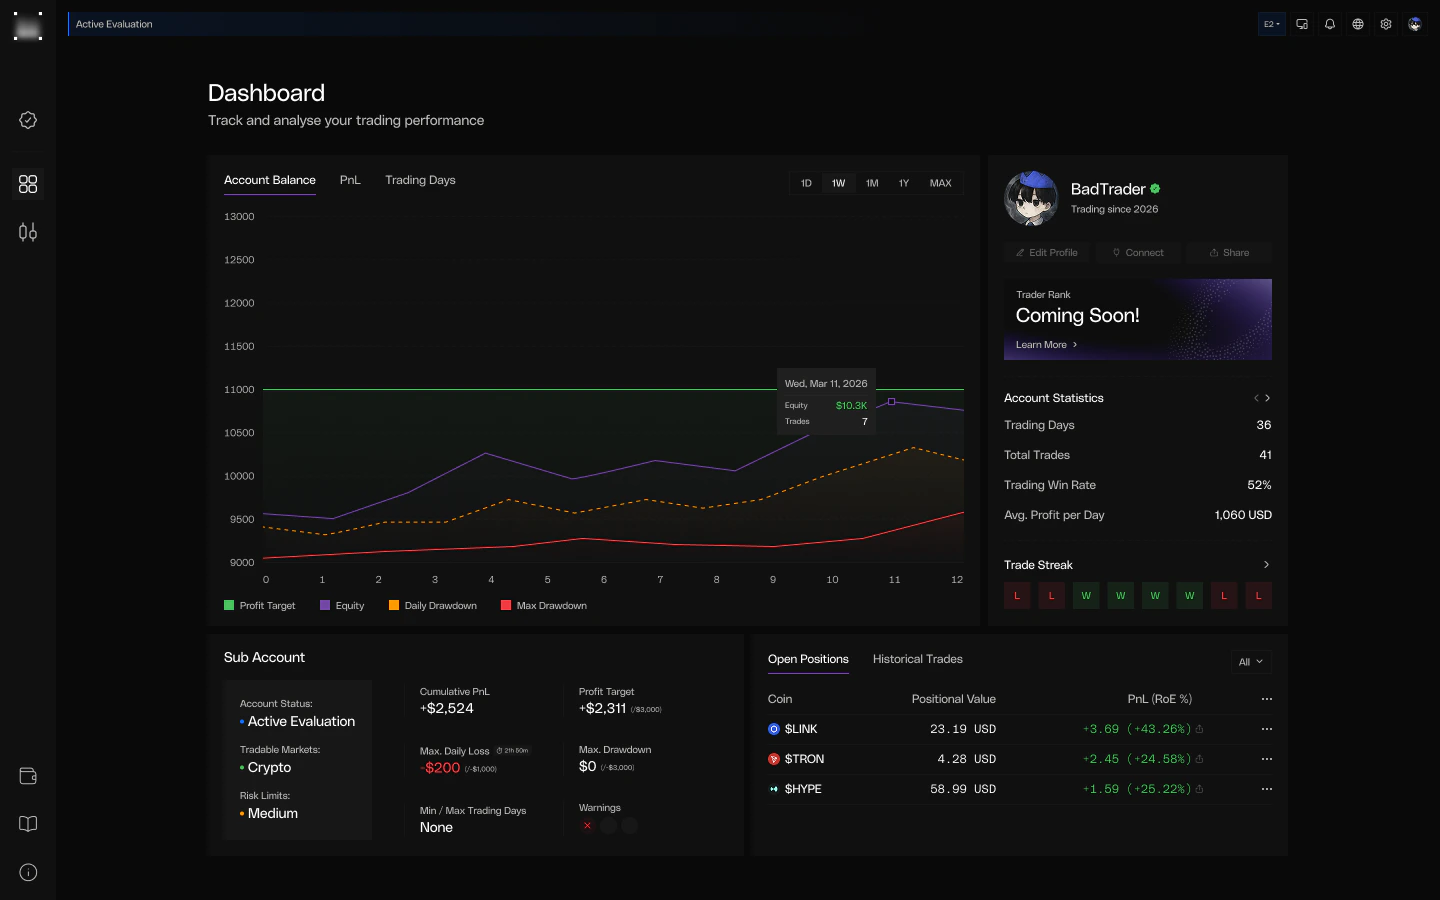
 Equity curve plotted against your profit target, daily drawdown, and max drawdown levels. Hover any point to see equity value and trade count for that period.
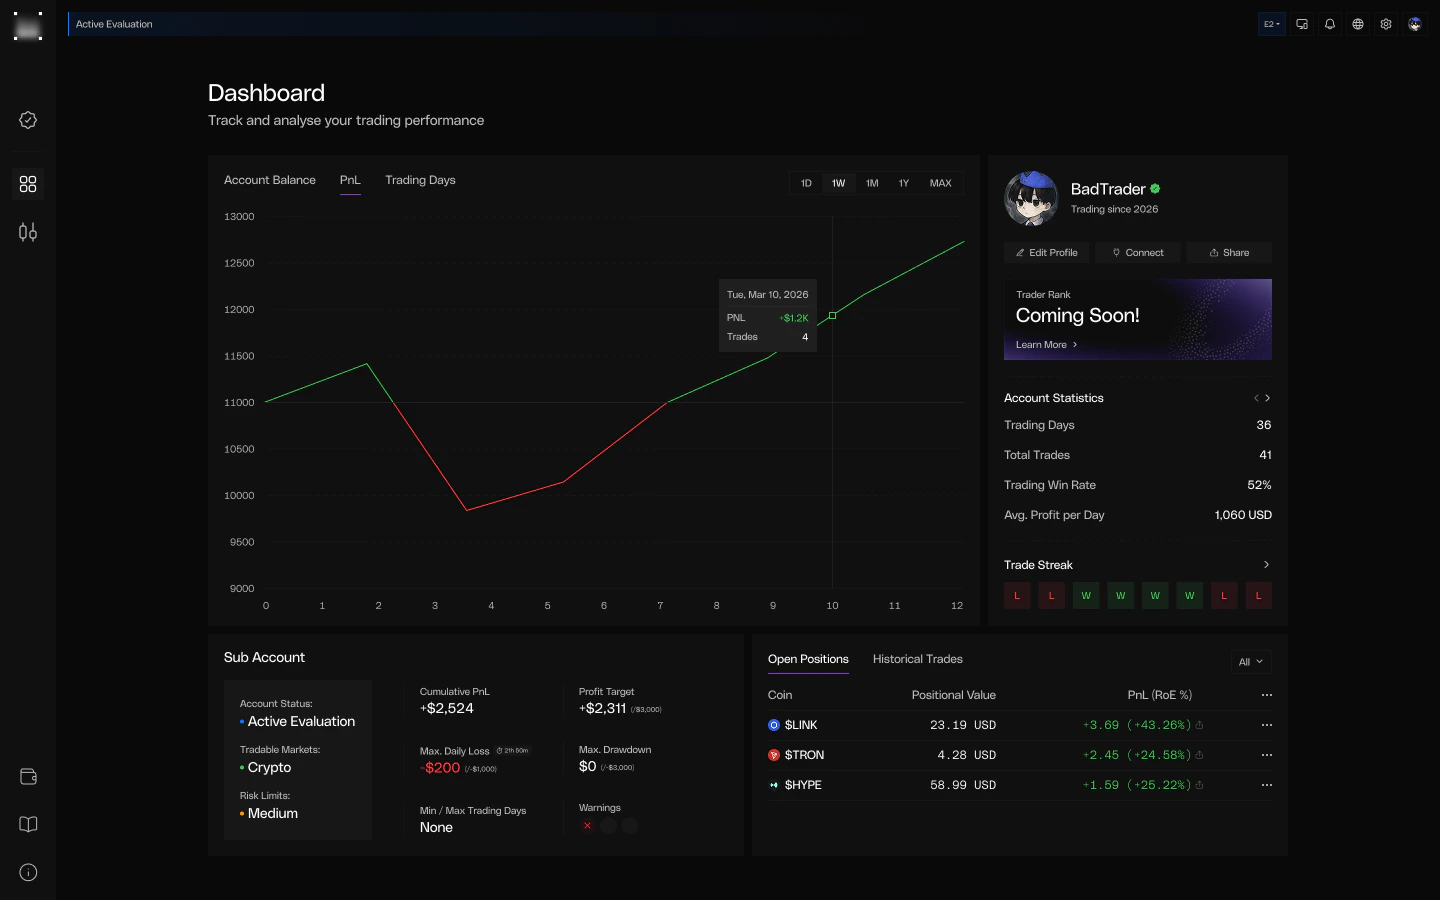
 Cumulative PnL chart tracking net profit over time. PnL is calculated as realized PnL minus fees plus funding - matching how Hyperliquid computes account-level returns.
 ## Account Statistics
Lifetime aggregates for the selected sub-account. Metrics are computed from closed positions only - open positions are excluded until they close.
| Metric | Description |
| ----------------------- | -------------------------------------------------------------------------------------------------------------- |
| **Trading Days** | Days with at least one position opened or closed (UTC boundaries) |
| **Total Trades** | Total closed positions across the account lifetime |
| **Win Rate** | Winning trades / total closed trades. Break-even trades (PnL = 0) count toward total but not as wins or losses |
| **Avg. Profit per Day** | Net PnL (after fees and funding) divided by days since account creation |
This is the sub-account view - each assessment and funded account has its own
statistics. For stats aggregated across **every account you own**, see the
[Home page](/docs/home).
## Sub-Account Overview
Each sub-account displays its current status and risk parameters at a glance.
| Field | Description |
| -------------------- | ------------------------------------------------------------------------- |
| **Account Status** | Active evaluation, passed, or breached |
| **Cumulative PnL** | Lifetime net PnL (realized PnL - fees + funding) |
| **Profit Target** | Progress toward the required profit target amount |
| **Max Daily Loss** | Current daily loss relative to the daily loss limit, with countdown timer |
| **Max Drawdown** | Current drawdown relative to the max drawdown limit |
| **Tradable Markets** | Asset classes available for this account (Crypto, TradFi, or All Markets) |
| **Risk Limits** | Risk level tier assigned to the account |
## Trader Score
Coming soon.
## Account Statistics
Lifetime aggregates for the selected sub-account. Metrics are computed from closed positions only - open positions are excluded until they close.
| Metric | Description |
| ----------------------- | -------------------------------------------------------------------------------------------------------------- |
| **Trading Days** | Days with at least one position opened or closed (UTC boundaries) |
| **Total Trades** | Total closed positions across the account lifetime |
| **Win Rate** | Winning trades / total closed trades. Break-even trades (PnL = 0) count toward total but not as wins or losses |
| **Avg. Profit per Day** | Net PnL (after fees and funding) divided by days since account creation |
This is the sub-account view - each assessment and funded account has its own
statistics. For stats aggregated across **every account you own**, see the
[Home page](/docs/home).
## Sub-Account Overview
Each sub-account displays its current status and risk parameters at a glance.
| Field | Description |
| -------------------- | ------------------------------------------------------------------------- |
| **Account Status** | Active evaluation, passed, or breached |
| **Cumulative PnL** | Lifetime net PnL (realized PnL - fees + funding) |
| **Profit Target** | Progress toward the required profit target amount |
| **Max Daily Loss** | Current daily loss relative to the daily loss limit, with countdown timer |
| **Max Drawdown** | Current drawdown relative to the max drawdown limit |
| **Tradable Markets** | Asset classes available for this account (Crypto, TradFi, or All Markets) |
| **Risk Limits** | Risk level tier assigned to the account |
## Trader Score
Coming soon.